
Better Looking Tables with kable in Your R Markdown Documents
Introduction
If you're using knitr with R markdown documents, you've probably come across the ubiquitous Xtable to display your dataframes and have had to wrestle with either LaTeX or css to get the tables to display with any sense of readability. The kable package comes with a lot of easy to use features, including bootstrap styling to make life much easier.
Xtable
Let's load the built-in mtcars table that comes with R and look at the Xtable first:
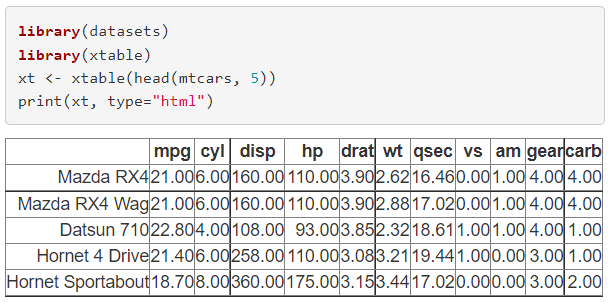
Not very readable, and no styling.
kableExtra
We can load the kableExtra library and use the default settings:
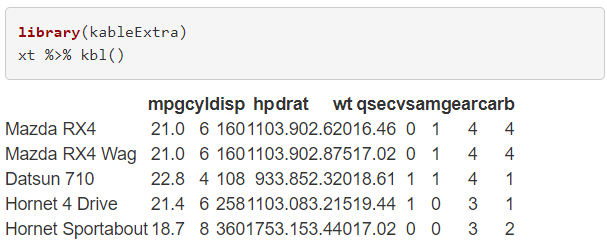
Note the use of the dplyr style piping format %>%. The Xtable object is piped into the kbl() function.
Better, but still not very readable. The columns are still squashed so tightly together that the headers are almost unreadable.
kable_styling
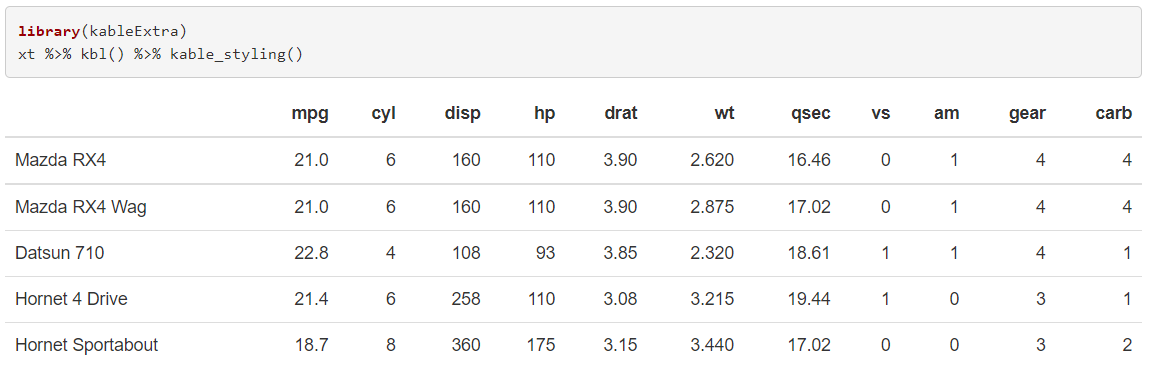
Enter the kable_styling() function. There are many options you can specify with this function, but even with default settings, we suddenly have a presentable, report ready table:
Using float to Create Multi-Column Output
By default, kable_styling() will display a table full width. You can turn this off, apply bootstrap options such as striped and interactive (so that a row highlights on mouse over), and set the position of the table to float to allow you to display text alongside your table:
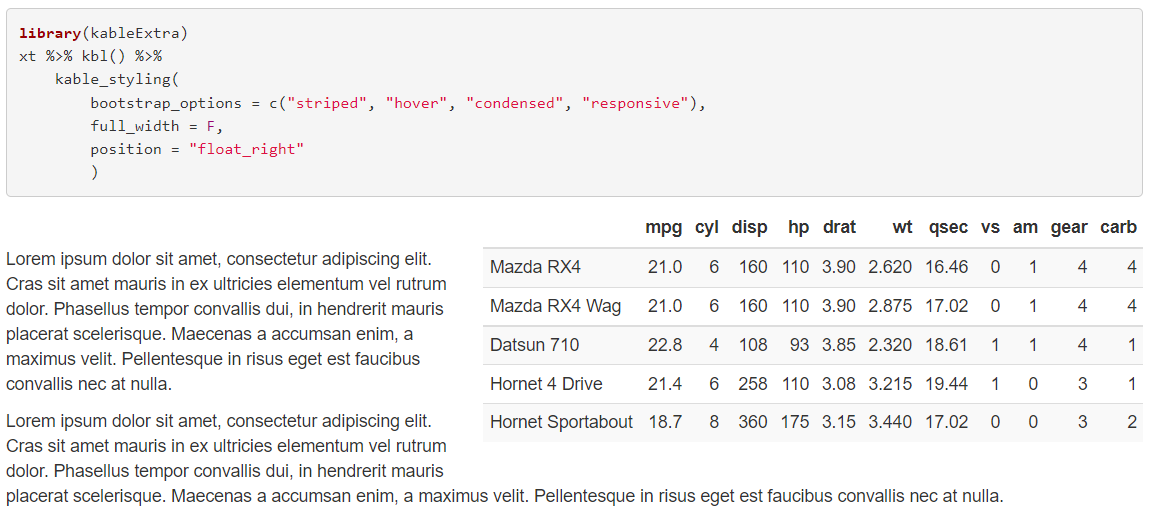
The page content (text in this case) wraps around the table as the table has float attribute set to right. This works fine on certain screen sizes, but you'll run into trouble with layout to make this truly responsive.
See my following article on using multiple-columns in R markdown to produce responsive output to overcome this problem and produce a much more robust solution.
Kable is very well documented on the CRAN website, well worth reading to get an understanding of all the rich features available.
Example Code
If you're interested in the R markdown file I used to create these snapshots, you can find it below:
## Xtable

```{r carsXtable, results="asis"}
library(datasets)
library(xtable)
xt <- xtable(head(mtcars, 5))
print(xt, type="html")
```

## kable Extra table

```{r carsktable, results="asis"}
library(kableExtra)
xt %>% kbl()

```

## kable extra table with styling

```{r carskxtable, results="asis"}
library(kableExtra)
xt %>% kbl() %>% kable_styling()

```

## kable extra table with more styling and float right

```{r carskxtable2, results="asis"}
library(kableExtra)
xt %>% kbl() %>%
    kable_styling(
        bootstrap_options = c("striped", "hover", "condensed", "responsive"),
        full_width = F,
        position = "float_right"
        )

```


Lorem ipsum dolor sit amet, consectetur adipiscing elit. Cras sit amet mauris in ex ultricies elementum vel rutrum dolor. Phasellus tempor convallis dui, in hendrerit mauris placerat scelerisque. Maecenas a accumsan enim, a maximus velit. Pellentesque in risus eget est faucibus convallis nec at nulla.