Tech Blog
Here I'll be sharing insights from my professional experiences and studies in data science and web development. There'll be plenty of Wagtail, Django and Python, a bit of JavaScript and CSS thrown in, and more on data science & engineering. There might even be a bit of time for some project management and business analysis too.
I'll also provide insights into how this site was made, as well as code examples and thoughts on how those could be further developed.
Feel free to leave questions or comments at the bottom of each post - I just ask people to create an account to filter out the spammers. You won't receive any unsolicited communication or find your email sold to a marketing list.

Better Looking Tables with kable in Your R Markdown Documents
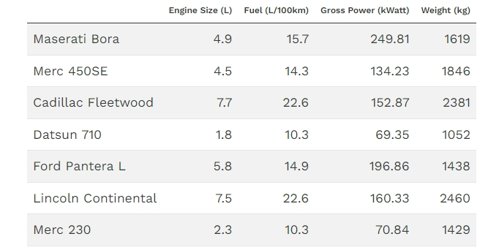
If you're using knitr with R markdown documents, you've probably come across the ubiquitous Xtable to display your dataframes and had to wrestle with either LaTeX or css to get the tables displaying with any sense of readability. The kable package comes with a lot of easy to use features including bootstrap styling to make life much easier.
2022-01-31 10:09:02 UTC

Adding Multi-column Formats to R Markdown Documents
It's possible to insert script tags inside raw HTML blocks and run your R code from there, but this is kind of nasty and takes the code out of the runnable framework, which is not a good idea where variables are being created/modified and used later on.
R Markdown supports some basic HTML elements. It also has its own notation for the <div> tag using the triple colon notation ::: for both opening and closing the element and, unlike using <div>, knitr won't auto-close these.
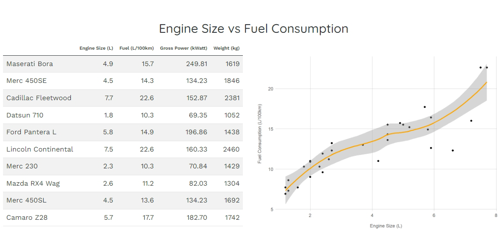
Learn how to use this and create a bootstrap responsive multi-column output directly from knitr.
2022-02-08 11:36:45 UTC

Embedding Shiny Apps for Interactive Data Analysis
Shiny Apps are great tool for creating interactive R programs which can be embedded into any web page.
Depending on the app, it can be built as a dashboard for reporting and analysis, extracting data or even running fully fledged machine learning algorithms based on your requirements.
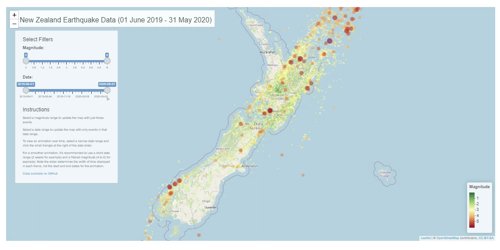
This example walks you through creating an interactive Leaflet Map, publishing it to a Shiny Server and embedding it in your website.
2022-04-08 18:40:54 UTC
